Simulate the impact of sun position, wind direction and speed, fog, and lighting at any time of day, at any location worldwide, within a realistic 3D perspective. Run precise simulations for shadow flicker, noise, and visibility (ZVI), and assess risks related to ice or blade throw from wind turbines. EnergyPlanner provides simulation modules to optimize energy park layouts, reduce risks, and clearly communicate complex information to residents, authorities, and investors.
Impact of date, time, sun position and wind direction
Sun position and wind direction, based on date, time, and location, influence how objects within an energy park are experienced. Think of panel glare, shadows on buildings, or the visibility of lighting at night. These simulations provide essential insights for spatial integration, visual quality and regulatory compliance.
-
Assess disruptive solar panel reflections.
-
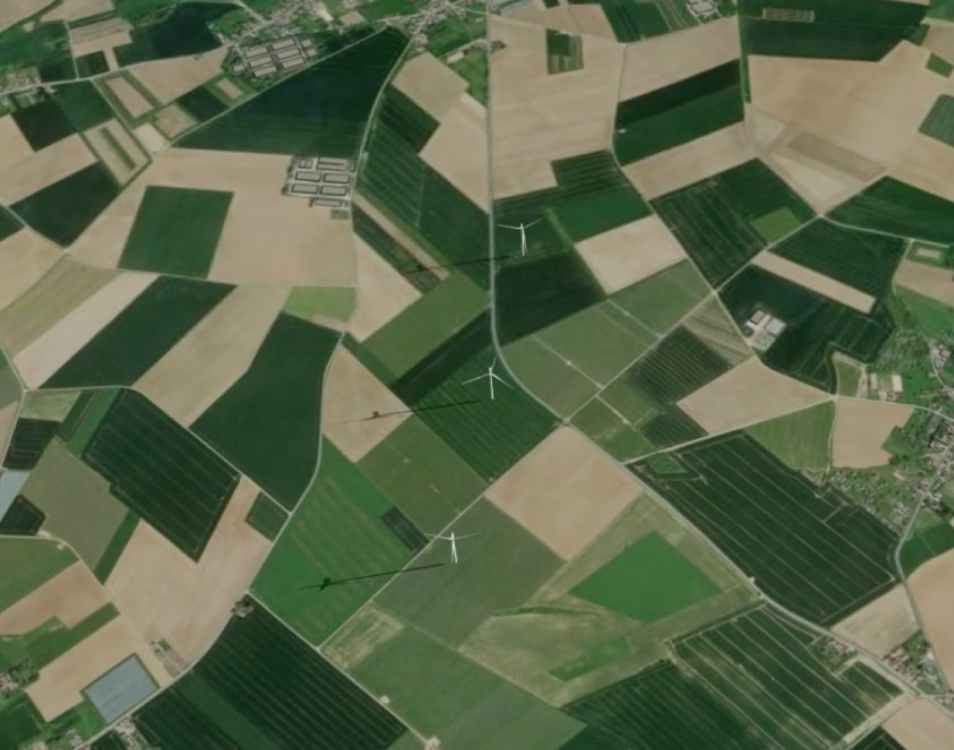
View real-time shadow impact of objects on the environment.
-
Analyze shading from trees, hedges, or fences on solar farm output.
-
Simulate fog, day-night conditions, and the effect of lighting on the surroundings.
Shadow flicker simulation
Conduct detailed analyses to assess the impact of wind turbine shadow flicker. Calculate the effects of sun position and sunshine probability on nearby receptors, verify compliance with local regulations, and test mitigating measures such as controlled turbine shutdowns.
-
Calculate shadow flicker based on sunshine probability, date, time, and location.
-
Check compliance with national regulations and set exposure limits (e.g., max. 5 hours and 40 minutes per year).
-
Apply curtailment scenarios and evaluate the impact on designated receptors.
-
Visualize shadow flicker contours on maps, export to KML, or generate detailed reports.
Seasonal shadow casting animations
These 30-second animations visualize the cast shadow of a wind farm per season. This allows stakeholders to see the impact in advance from a bird's-eye view.
The sun is tracked at three fixed times of the year:
-
Summer solstice (June 21)
Highest sun position and longest day, with short shadows. -
Equinox (March 21 / September 21)
Equal duration of day and night (spring and autumn). -
Winter solstice (December 21)
Lowest sun position, with the longest shadows.
Noise simulation
Calculate sound emissions from wind turbines or other installations based on ISO 9613-2 to evaluate their environmental impact. Verify compliance with legal noise limits and support Environmental Impact Assessments (EIA) and public communication with clear visual and numerical outputs.
-
Calculate noise levels per octave band based on sound spectrum input.
-
Account for daytime, evening, and nighttime conditions, distance to receptors, reflections, and ground attenuation.
-
Verify against applicable standards (e.g., 49 dB(A) day / 39 dB(A) night).
-
Visualize sound contours on maps, export to KML, or generate detailed reports.
Zone of Visual Influence (ZVI)
Calculate the visibility of turbines, solar panels and high-voltage towers through advanced line-of-sight analysis based on DTM/DSM data. Simulations consider terrain, observation height, partial visibility, and, where available, obstructions such as vegetation or buildings. EnergyPlanner supports this process with advanced visualization tools for policy support, public participation, and permitting.
-
Calculate topographic visibility using ray tracing toward observation points at user-defined height.
-
Identify whether objects are fully, partially, or not visible, with support for unlimited receptors.
-
Include visibility barriers such as trees, buildings, or other obstructions for enhanced accuracy.
-
Generate turbine visibility maps and summary reports per receptor location.
Turbulence & ice or blade throw
Simulate dynamic risk zones around wind turbines, such as turbulence, turbine separation distances and ice or blade fragment throw. These insights are essential for defining the appropriate safety zones and ensuring careful landscape integration.
-
Turbulence radius – Determine turbine spacing using wind direction and cross/downwind separation to reduce wake effects and wear.
-
Rotor diameter – Critical for defining turbine spacing, impacting yield and wake size.
-
Topple distance – Simulate fall distance for safety zoning in case of structural failure.
-
Ice throw distance – Assess risk areas for ice fragments under varying wind speeds and rotor RPM.
Request a free demo
Ready to see EnergyPlanner in action?
Live walkthrough
60-minute session
Virtual demo

Direct contact
Prefer to speak with us directly? Feel free to get in touch with one of our specialists!

